Quality of Pitch (QOP™)
Greiner Agencies Inc. introduced the first objective pitch quantification index for baseball at the SABR Analytics Conference in Phoenix, Arizona on Thursday, March 12, 2015.
US Patent No. 10,737,167 B2
What is it?
“The rating of how difficult a pitch is to hit on a scale of 0 to 10; calculated from movement (rise, lateness of break, vertical break, horizontal break), location, and speed”
For decades velocity (mph) has been accepted as the primary tool for
identifying pitching talent in the game of baseball. However, this is
only one of several variables that determine the quality of a pitch. In
addition to velocity, numerous other subjective statistics such as
E.R.A. and batting average have been used to to evaluate performance.
These statistics are heavily influenced by the opposition, umpires,
defensive shifts, and other variables outside of the pitchers control.
The emergence of pitch analysis technology has revealed revolutionary raw data with limitless analytic possibilities. By consolidating this data into one number we can encapsulate all measurable pitch variables (rise, break point, vertical break, horizontal break, location, and speed) to determine an objective calculation of pitch quality. This qop™ calculation is a true measurement of pitch value with all other subjective factors removed. A standardized scale can evaluate players and rank them on more than just velocity and result.

What is it for?
Objective Comparison
Pitch Quantification enables us to rate and compare pitch vs pitch, game vs game, and player vs. player using qop™. A true evaluation of performance should be based on what the pitcher can actually control.
TALENT iDENTIFICATION
The qop™ value is consistent internationally and can objectively rate players regardless of league, competition or country. This measurement can also be useful as a scouting tool when drafting amateur players.
Injury Prevention
A quantification index allows us to identify qop™ patterns that could indicate deterioration as a warning sign of potential injury, allowing team management to take a proactive approach in protecting a pitcher’s health and well-being.
Batter Evaluation
By establishing qop™ data we can then assess a hitter by validating or contradicting his batting average. The feedback from this data can also confirm or refute statistical anomalies.
Examples:


Hyun-Jin Ryu: +8.07 qopv™
• Above Average Quality
• Decent Break
• Very Late Break
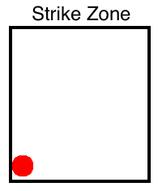
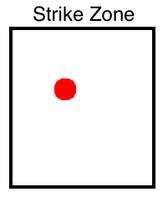
• Very Good Location


Clayton Kershaw: +2.96 qopv™
• Below Average Quality
• Poor Location
• Good Velocity – 92mph
• No break

